![]()

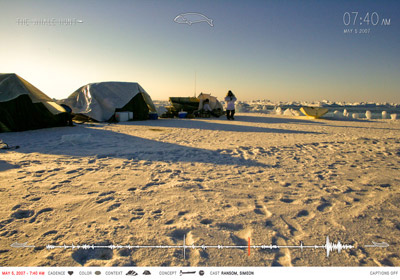
Running along the bottom edge of the screen is a timeline, representing the entire whale hunt trip, beginning with the taxi ride to Newark airport and ending with the butchering of the second whale, seven days later. The timeline is pictured as a medical heartbeat graph whose magnitude at each point corresponds to the photographic frequency (and thus the level of excitement) at that moment. The position of the presently visible photograph is indicated by a glowing red bar. Moving the cursor along the timeline causes the bars to spread and contract organically, allowing the viewer more easily to isolate a single moment in time. Applying constraints (described below) causes the timeline to change shape, as various substories are isolated and revealed.
![]()
Immediately to the left and right of the timeline are two harpoon heads, which are buttons that cause a shift to the previous or next photograph, respectively.
![]()
![]()

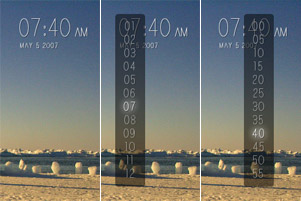
The 3,214 images are conceptually represented as a long horizontally scrolling filmstrip, which corresponds in sequence to the heartbeat timeline mentioned above. The background color of each spot on the filmstrip is the average pixel color of the photograph at that position. Clicking the timeline or the harpoon buttons causes the filmstrip to scroll to the requested point. As the full resolution images load, lower resolution pixelated versions appear.
![]()
![]()
Below the timeline is a row of small text and icons, indicating a variety of metadata about the currently visible photograph. In addition to the date and time the photo was taken, also listed are the cadence of the photo (what was the level of excitement at that moment), its average color, its context (where it was taken), its concepts (what ideas are represented in the photo), and its cast (who is pictured in the photo). Rolling over the icons causes explanatory labels to appear.
![]()
![]()

In the bottom right corner of the screen is a button that toggles captions on and off. Captions provide short textual commentary explaining the currently visible photograph.
![]()

![]()

The cast constraints allow the viewer to filter photos that contain certain people, incluing: Abe, Ahmakak, Andrew, Crawford, David, Edward, Howard, Joe, Jonathan Josiah, Kat, Ransom, Ron, Rony, Samuel, Simeon, Walter, the 1st whale, and the 2nd whale.
![]()

The concept constraints allow the viewer to filter photos that reference certain ideas, including: blood, boats, buildings, food, games, kids, Moby Dick, paperwork, prayer, sleep, timelapse, tools, vehicles, whales and wildlife.
![]()

The context constraints allow the viewer to filter photos that were taken in certain places, including: New York City; airplanes and airports; Barrow, Alaska; the Patkotak family house, the Arctic Ocean, the Patkotak whaling camp and the Ahkivgaq whaling camp.
![]()

The cadence constraints allow the viewer to filter photos based on the excitement level at the time the photo was taken. The five cadence levels include:
- Slow (1 photo in 5 minutes)
- Relaxed (2 - 4 photos in 5 minutes)
- Fast (5 - 14 photos in 5 minutes)
- Frantic (15 - 24 photos in 5 minutes)
- Racing (over 25 photos in 5 minutes)
![]()
![]() In addition to the basic Whale Hunt interface, allowing for the viewing of individual photos, there are three visualization modes, which allow high-level browsing of the entire data set, revealing trends in coloration and photo frequency. These modes are accessed using buttons in the bottom-right corner of the screen.
In addition to the basic Whale Hunt interface, allowing for the viewing of individual photos, there are three visualization modes, which allow high-level browsing of the entire data set, revealing trends in coloration and photo frequency. These modes are accessed using buttons in the bottom-right corner of the screen.
![]()
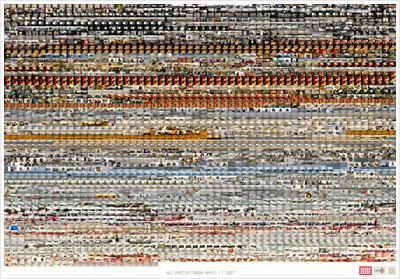
![]() Mosaic mode shows all 3,214 photos simultaneously, arranged chronologically in a large colorful grid. This mode reveals coloration patterns in the photographs over time, signaling the changing environment from New York City, to airplanes, to Barrow, to the Arctic Ocean. Any photo can be clicked and selected.
Mosaic mode shows all 3,214 photos simultaneously, arranged chronologically in a large colorful grid. This mode reveals coloration patterns in the photographs over time, signaling the changing environment from New York City, to airplanes, to Barrow, to the Arctic Ocean. Any photo can be clicked and selected.
![]()

![]() Timeline mode displays all 3,214 photos as small colored boxes, arranged chronologically. Each column represents a single 30-minute period, the height of the column indicating the number of photographs that were taken during that period. This mode reveals the changing pace of photography over the course of the trip, showing the range of experience, from the thrilling to the dull. Any colored box can be clicked to select its corresponding photograph.
Timeline mode displays all 3,214 photos as small colored boxes, arranged chronologically. Each column represents a single 30-minute period, the height of the column indicating the number of photographs that were taken during that period. This mode reveals the changing pace of photography over the course of the trip, showing the range of experience, from the thrilling to the dull. Any colored box can be clicked to select its corresponding photograph.
![]()
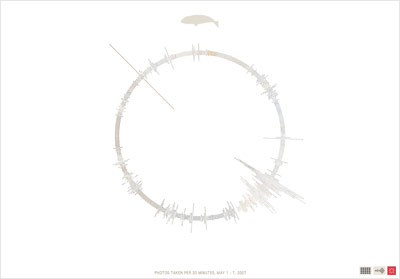
![]() Pinwheel mode is similar to timeline mode, displaying all 3,214 photos in chronological order, separated into 20-minute segments. The height of each segment indicates the number of photographs taken during that period of time. Any colored box can be clicked to select its corresponding photograph.
Pinwheel mode is similar to timeline mode, displaying all 3,214 photos in chronological order, separated into 20-minute segments. The height of each segment indicates the number of photographs taken during that period of time. Any colored box can be clicked to select its corresponding photograph.
![]()
